What Is a Stacked Bar Chart in Excel? A Complete 2026 Guide
 Carlos Garcia5/16/2026
If you've got data that breaks down into categories within categories — sales by region split by product, monthly revenue split by channel, survey responses split by demographic — a stacked bar chart in Excel is the cleanest way to show both the total and the composition in a single visualization. This article walks through exactly what a stacked bar chart is, how to make one in Excel in 2026, the three main variations available, and the practical scenarios where it's the right call (versus when you should use a different chart type).
Free SEO + AI Search Audit. Stacked bar charts visualize your business data. But how visible is your business in the searches your customers actually run? Run your free audit → to see exactly where your site stands in Google AND in AI platforms like ChatGPT, Claude, Perplexity, and Gemini.
What Is a Stacked Bar Chart in Excel?
In simple terms, a stacked bar chart is a bar chart where each bar is divided into segments representing sub-categories that together add up to the bar's total. Where a regular bar chart shows a single value per bar (total sales by region), a stacked bar chart shows multiple values stacked on top of each other (sales by region, split by product line within each region).
Think of it as a bar chart and a pie chart combined into one visualization. The bar's overall length tells you the total. The segments inside the bar tell you the composition of that total. You can compare totals across categories (which region has the most sales?) and composition within categories (is the product mix the same across regions?) at the same time.
Excel offers three main flavors of stacked bar charts:
- Stacked Bar Chart: horizontal bars stacked from left to right. Best when category names are long.
- Stacked Column Chart: vertical columns stacked from bottom to top. Best for time-series data (months across the x-axis).
- 100% Stacked Bar/Column: every bar is the same total length (100%), and segments show share of total. Best for comparing composition across categories regardless of absolute totals.
How to Make a Stacked Bar Chart in Excel (Step-by-Step)
Building a stacked bar chart in Excel takes about 30 seconds once your data is organized correctly.
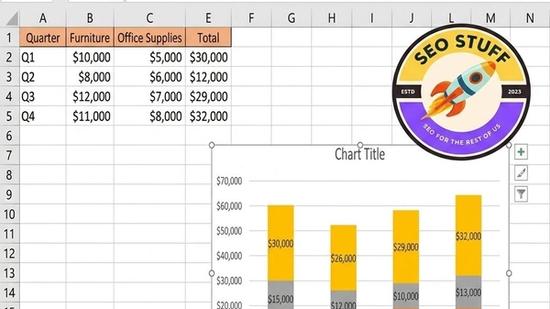
- Organize your data in a matrix. Categories down the rows, sub-categories across the columns, values in the cells. Example: rows are regions (North/South/East/West), columns are product lines (Product A, B, C), and each cell has the sales number for that region+product combination.
- Select the full data range including row labels and column headers.
- Go to Insert → Bar Chart (or Column Chart for vertical) and choose Stacked Bar (or Stacked Column).
- Excel inserts the chart. Each row becomes a bar, and each column's value becomes a segment within that bar.
- Verify the orientation. If Excel got the rows and columns flipped from what you expected, click the chart → Chart Design → Switch Row/Column to swap them.
- Customize colors and labels. Click any segment to format that data series (color, border, data label). Add a chart title, axis titles, and a legend.
- (Optional) Convert to 100% Stacked by Chart Design → Change Chart Type → 100% Stacked Bar. This switches from absolute values to percentages of total.
That's it. To update with new data, just edit the source range and the chart refreshes automatically.
Useful Customizations Worth Knowing
A default Excel stacked bar chart is functional. A few tweaks make it presentation-ready.
Show Values Inside the Segments
By default, segment values aren't shown. To add them: right-click any data series → Add Data Labels. Excel inserts the values inside each segment. For 100% stacked charts, change the label format to show percentages instead of absolute numbers.
Order Segments Strategically
Excel stacks segments in the order they appear in your source data. To put your most important category first (visually anchored at the chart's start), reorder the columns in your source data, or right-click a series → Select Data → reorder the series with the up/down arrows.
Use Color Strategically
For comparison purposes, give your "key" category a strong color (your brand color, or a striking accent) and use muted neutrals for the others. The eye will track the key segment across all bars, making comparison easy.
Add a Total Label Above Each Bar
Excel doesn't natively show the total of all stacked segments above the bar. To add one: insert an additional series with the total values, change its chart type to Line (so it doesn't appear as a bar), set the line to invisible, and add data labels to that invisible line series. The labels show the totals positioned above each bar.
Free SEO + AI Search Audit. Stacked bar charts let you see your data composition clearly. The same principle applies to your website's search visibility — most teams only look at one slice (organic Google) and miss what's happening in AI search. Run a free audit of how your site performs in Google AND in ChatGPT, Claude, Perplexity, and Gemini.
Switch Between Stacked and 100% Stacked
Often the most useful comparison is to show both side-by-side: one chart showing absolute values, one showing percentages. The absolute chart tells you "which region is biggest," the percentage chart tells you "which has the best product mix."
When Should You Use a Stacked Bar Chart?
Stacked bar charts are widely useful but not universally appropriate. Here's when they shine:
1. Showing Total + Composition Simultaneously
This is the textbook use case. When your audience needs to know both "how much" and "made up of what," a stacked bar chart delivers both in one visual.
2. Comparing Composition Across Categories
If you want to compare "is the product mix in North different from the product mix in South?", a 100% stacked bar makes that comparison instantly visible.
3. Time-Series with Categorical Breakdowns
For monthly or quarterly data broken down by category (revenue by month, split by channel), a stacked column chart shows the total trend over time AND the changing composition.
4. Survey Responses with Multiple Choice
For survey questions where respondents pick multiple categories or rate things on a scale, stacked bars show response composition cleanly.
5. Budget or Resource Allocation
Showing how budgets, headcount, or resources are distributed across teams or projects works naturally in a stacked bar format.
Free SEO + AI Search Audit. Whether you visualize data with charts or dashboards, the underlying question is the same: what's actually working and what isn't? For your website, you can get that same clarity. Get a free audit of exactly how your site performs in Google AND every major AI search platform — and where the gaps are.
When NOT to Use a Stacked Bar Chart
Just as important as knowing when to use a stacked bar is knowing when it'll confuse rather than clarify.
Many small segments. If you have 8+ sub-categories per bar, segments become too small to read. Use a grouped bar chart or a different visualization.
Negative values. Stacked bars can't handle negative numbers cleanly. Use a different chart type or split positive/negative into separate visualizations.
Comparing specific sub-category values. It's hard to compare "Product B sales in North vs South" in a stacked bar because the segments don't share a common baseline. Use a grouped bar chart instead.
When precision matters more than overview. Stacked bars are good for "show me the shape of the data." For exact comparisons, a table of numbers or a grouped bar chart is more precise.
Limitations of Excel Stacked Bar Charts
Sub-category comparison is hard. Because segments don't start from the same baseline (except the first one), it's difficult to visually compare values of the same sub-category across different bars.
Color choice matters a lot. With many segments, picking distinguishable colors becomes critical. Use Excel's preset color schemes or import a custom palette.
Labels can crowd. With many small segments, the data labels overlap and become unreadable. Selectively hide labels for small segments.
Chart type selection is tedious. Excel's chart type menu has many similar-looking options. Make sure you've selected actual "Stacked" and not "Clustered" — they look similar in the preview.
Updating data ranges is manual. If you add new rows to your source data, the chart doesn't automatically include them unless you used a Table (Insert → Table) for the source data.
3D variants distort perception. Excel offers 3D stacked bar charts. Avoid them — the perspective makes segment sizes look different than they actually are.
Final Thoughts
A stacked bar chart in Excel is one of the most versatile visualizations in your toolkit — perfect for showing how a total breaks down into parts, comparing compositions across categories, and tracking how the mix shifts over time. Use it when you need to convey both magnitude and composition simultaneously. Skip it when sub-category precision matters more than overview.
The deeper truth in data viz: every chart type is a tool with a job. Use the right one for the job and your audience gets it instantly. Use the wrong one and your point gets lost. Same logic applies to where you invest in being visible online. In 2026, the brands compounding fastest aren't just on Google — they're showing up in ChatGPT, Claude, Perplexity, and Gemini where buyers increasingly ask AI for recommendations. Run a free audit to see exactly where your site stands across every major search and AI platform — and which fixes will move the needle fastest.