What Is an Engaged Session in Google Analytics 4? (2026 Guide)
 Carlos Garcia5/23/2026
If you've opened a Google Analytics 4 report and seen "Engaged sessions" as a primary metric — and wondered exactly what counts as engaged, how it differs from regular sessions, and why GA4 uses it instead of the old bounce-rate model — you're not alone. An engaged session in GA4 is a session that lasted at least 10 seconds, OR had two or more pageviews/screen views, OR included at least one key event (formerly called conversion event); a session needs to satisfy any one of those three conditions to count as engaged. This guide explains exactly how GA4 defines and measures engaged sessions, how to use the engagement rate metric, why GA4 replaced bounce rate with engagement, and where the metric falls short.
Free SEO + AI Search Audit. Engaged sessions tell you who's paying attention on your site. A free SEO + AI search audit tells you who's paying attention to your brand across Google AND in AI search engines like ChatGPT, Claude, Perplexity, and Gemini. Run your free audit → to see where your site stands in 60 seconds.
What Is an Engaged Session in GA4? The Direct Answer
In simple terms, GA4 marks a session as "engaged" if it meets at least one of three criteria:
- The session lasted 10 seconds or longer
- The user viewed two or more pages or screens during the session
- The user triggered one or more key events (e.g., purchase, sign-up, video completion)
If a session meets none of those criteria — for instance, the user landed on a page, stayed less than 10 seconds, viewed only that one page, and triggered no key events — the session is "not engaged."
The metric is the foundation of GA4's engagement rate, which is the percentage of sessions classified as engaged.
The Three Engaged Session Criteria, Explained
Each criterion in detail.
Criterion 1: 10+ Seconds Duration
GA4 measures session duration from the first event to the last event in the session. If the gap between those events is 10 seconds or more, the duration criterion is met. Even a single-page session counts as engaged if the user stayed on that page for 10+ seconds.
Importantly, GA4 uses the session_engaged event firing automatically once any of the criteria is met — it's not calculated retroactively at session end.
Criterion 2: 2+ Pageviews or Screenviews
Any session with two or more `page_view` events (web) or `screen_view` events (app) counts as engaged. This is the simplest path to engagement — even fast navigation through multiple pages qualifies.
Criterion 3: 1+ Key Event
If the user triggers a key event during the session (purchase, sign-up, form submission, video completion, or any custom-defined key event), the session is engaged regardless of duration or pageview count.
Note: GA4 renamed "conversions" to "key events" in early 2025. The mechanics are the same; the terminology shifted.
How GA4 Tracks Engagement
The technical mechanics under the hood.
The session_engaged Event
When any of the three criteria is met, GA4 fires an automatic `session_engaged` event. This event tags the entire session as engaged. The flag persists for the rest of the session's events.
Engagement Time Calculation
GA4 measures user-engaged time as time spent on a page or screen while it's in the foreground (browser tab is active, app is in the foreground). Background tabs and minimized apps don't count.
Cross-Platform Consistency
The same engagement criteria apply to web (GA4 web data streams) and apps (GA4 app data streams). The 10-second threshold and pageview/key event logic are consistent.
Per-User Behavior
Engagement is measured per session. The same user can have engaged and unengaged sessions in the same day. GA4 aggregates engagement metrics at the user level for retention analysis.
Engaged Sessions vs Total Sessions
How the two metrics relate.
Total Sessions
Every session GA4 records, engaged or not. This is the raw traffic count.
Engaged Sessions
The subset of total sessions that met at least one engagement criterion.
Engagement Rate
`Engaged sessions / Total sessions` — expressed as a percentage. A 60% engagement rate means 60 out of every 100 sessions were engaged.
Engaged Sessions Per User
Average number of engaged sessions per user over a date range — useful for measuring how often returning visitors come back with intent.
Why GA4 Replaced Bounce Rate With Engagement
Universal Analytics used bounce rate; GA4 uses engagement rate. The shift wasn't arbitrary.
Bounce Rate Was a Single-Pageview Measure
Universal Analytics defined bounce as "session with only one pageview." This said nothing about whether the user engaged with that one page. A user who read an article for five minutes and bounced was the same as a user who left after one second.
Engagement Captures Time Spent
GA4's 10-second criterion accounts for users who read a single page deeply without navigating further. Long-form content sites that consistently looked "bouncy" in UA now show appropriate engagement signals.
Engagement Captures Action
The key event criterion means a session with one pageview but a form submission is correctly classified as engaged. UA missed this nuance.
Engagement Is the Inverse of "Bounced" in GA4
GA4 still calculates a bounce rate, defined as `1 - engagement rate`. So if engagement rate is 60%, bounce rate is 40%. The metric exists for backward compatibility but isn't the default GA4 KPI.
How to Find Engaged Sessions in GA4 Reports
Where the metric shows up.
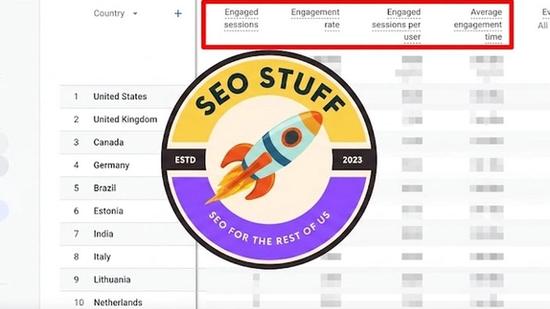
Default Acquisition Reports
In the Traffic acquisition and User acquisition reports, "Engaged sessions" is one of the default metrics shown alongside Sessions, Views, and Engagement rate.
Real-Time Reports
The Real-Time report shows engaged sessions for the last 30 minutes.
Explorations
In Explorations, add Engaged sessions, Engagement rate, or Average engagement time per session as metrics. Combine with any dimension (source, medium, page, campaign) to slice.
Audience Builder
You can build audiences based on engagement criteria — e.g., "users with at least 3 engaged sessions in 28 days." Useful for high-intent remarketing.
Reports for Specific Pages
The Engagement → Pages and screens report shows engaged sessions per page, so you can see which content drives engagement vs which doesn't.
Free SEO + AI Search Audit. Engagement rate measures who pays attention on your site. AI search citations measure who finds you in the first place. A free SEO + AI search audit ties both ends together. Get a free audit.
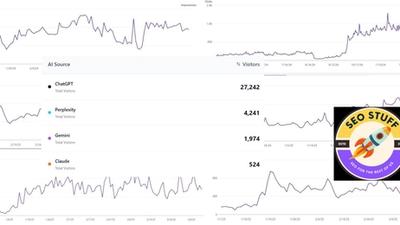
Common Engaged Session Patterns by Source
Typical engagement rates by traffic source.
Organic Search
Usually the highest-engagement source. Users searched for something specific and landed on your content. Engagement rates of 65-80% are normal.
Direct
Often high engagement — users who type your URL are intentional. 60-75% is typical.
Paid Search
Slightly lower than organic — the click was prompted by your ad rather than initiated by the user. 50-65% is normal.
Referral
Highly variable — depends on the referring site's audience match. 40-70% range.
Organic Social
Often the lowest engagement among major channels — users tapping through social feeds are in low-intent browsing mode. 30-50% is typical.
Display / Paid Social
Usually the lowest of all — interruption-based traffic. 20-40% is common.
Often the highest of all — these are already-engaged contacts. 70-85% is common.
AI Search Citations (Where Visible)
In 2026, sessions traceable to AI search engines tend to engage heavily — the user already read about you in an AI answer and clicked through for more. Hard to measure because most AI search traffic still lands in "Direct."
How to Improve Your Engagement Rate
Practical levers if your engagement rate is low.
1. Match Page Content to Source Intent
If paid display is driving traffic to a page that doesn't match what the ad promised, engagement will be low. Ensure ad-to-landing-page alignment.
2. Reduce Page Load Time
A page that takes 5+ seconds to load loses users before the 10-second engagement threshold can fire. Aim for sub-2-second LCP.
3. Make Internal Linking Obvious
Easy navigation to related content boosts the 2-pageview engagement criterion. Add "Related articles," "Next in series," or topic clusters.
4. Surface Key Events Higher in the Page
If the user has to scroll to find your sign-up form or purchase button, fewer engaged sessions complete the key event before leaving.
5. Improve Content Quality
Time-on-page correlates with content depth and relevance. Thin or repetitive content drives quick exits below the 10-second threshold.
6. Filter Out Bot Traffic
If your traffic includes bots that fire one event and leave, your engagement rate will look artificially low. Filter out known bot user agents.
Common Issues With Engaged Sessions
A few patterns that confuse analysts.
1. "My Engagement Rate Crashed Overnight"
Usually caused by a deployment that broke event tracking — `page_view` events not firing on certain pages, or tag manager misconfiguration. Check the Realtime report and the DebugView to identify the gap.
2. "Single-Page Apps Show Low Engagement"
If your SPA isn't firing `page_view` events on route changes, GA4 thinks every session is one pageview. Configure GA4 with History change events or manually fire `page_view` events on route changes.
3. "App Sessions Look Different"
Apps use `screen_view` instead of `page_view`. Ensure your mobile SDK fires `screen_view` events on each screen navigation, otherwise engagement looks artificially low.
4. "Engaged Sessions Don't Match Sessions"
By definition, Engaged sessions ≤ Sessions. They should always be lower. If they match, you have a tag misconfiguration or an unrealistically clean data set.
5. "Cross-Domain Sessions Are Split"
If users navigate between two of your domains and cross-domain tracking isn't configured, each domain visit becomes a separate session, breaking engagement signals.
Engaged Sessions vs Other GA4 Engagement Metrics
A quick comparison.
Engaged Sessions
What it is: total sessions that met one of three engagement criteria
Average Engagement Time Per Session
What it is: mean time-in-foreground per session
Useful for: judging content depth
Engagement Rate
What it is: engaged sessions / total sessions
Useful for: a single quality KPI
Engaged Sessions Per User
What it is: average number of engaged sessions per user over the period
Useful for: measuring return engagement
Bounce Rate (GA4 Definition)
What it is: 1 - engagement rate (or total non-engaged sessions / total sessions)
Useful for: UA-era continuity
User Engagement (Event)
What it is: time-on-page event fired by GA4 automatically
Useful for: detailed page-level engagement analysis
Limitations of Engaged Sessions
A few honest caveats.
The 10-second threshold is arbitrary. Some genuinely valuable sessions complete in under 10 seconds (price check, status check, quick reference lookup) but are marked unengaged.
Single-page reads might be undercounted. A user reading a long-form article without scrolling much may not trigger engagement events even if reading time is meaningful.
App and web definitions don't perfectly match. Mobile app session engagement and web session engagement have different timing semantics. Comparing them directly is imprecise.
Privacy/consent tools affect it. Users who decline analytics consent don't show up in GA4 reports. Your engagement rate reflects only consenting users.
Bot traffic can dilute the metric. Bot pageviews that don't dwell or navigate make your engagement rate look worse than reality.
Final Thoughts
An engaged session in Google Analytics 4 is a session that lasted at least 10 seconds, had two or more pageviews, or triggered at least one key event. It's GA4's replacement for the old single-pageview bounce-rate model and gives a more meaningful signal about whether visitors are actually paying attention. The metric pairs naturally with engagement rate (engaged / total sessions), and you can use it to compare channels, content, and audiences. In 2026, engagement rate has become the default top-line quality KPI for most marketing teams using GA4.
Beyond engagement metrics, the bigger 2026 question for most marketing teams is whether your content is even being found by the right audience in the first place. Increasingly, buyers use AI search engines like ChatGPT, Claude, Perplexity, and Gemini for product recommendations — and most teams have zero measurement of how they show up there. While you're optimizing engagement on the visitors you have, you may be invisible in the AI answers deciding more and more buying decisions. Run a free audit to see exactly where your site performs across Google AND every major AI search platform — and which fixes will move your traffic the fastest this quarter.