What Is a Semantic Model in Power BI? Complete 2026 Guide
 Carlos Garcia5/20/2026
If you've ever opened a Power BI report and seen numbers that don't match another team's version of the "same" metric, you've experienced the cost of not having a shared semantic model. A semantic model is the data layer that sits between your raw source data and your reports — it defines tables, relationships, measures, business rules, and security. In 2026, Microsoft formally renamed "dataset" to "semantic model" in Power BI, making the concept harder to ignore. This article covers what a semantic model is, what it includes, how to build one, when to use it, and the practical limitations.
Free SEO + AI Search Audit. A semantic model gives your team one consistent view of business metrics. A free SEO + AI search audit gives you one consistent view of your visibility — across Google AND in AI search engines like ChatGPT, Claude, Perplexity, and Gemini. Run your free audit → to see exactly where your site stands in 60 seconds.
What Is a Semantic Model?
In simple terms, a semantic model is the data abstraction layer in Power BI (and Microsoft Fabric). It's the structured representation of your business data — tables, columns, relationships, calculated measures, hierarchies, and security rules — that reports and dashboards query against.
Think of it as the translation layer between raw database tables (which use cryptic column names like `cust_id_ext` and `txn_amt_usd`) and business-friendly concepts (which use names like "Customer ID" and "Sales Amount").
Microsoft officially renamed "dataset" to "semantic model" in late 2023. The underlying technology is the same — what changed is the terminology, emphasizing that it's a business-meaning layer rather than just a data container.
A semantic model includes:
- Tables and columns imported from source systems
- Relationships between tables (e.g., Sales.CustomerID → Customers.ID)
- DAX measures for calculations (e.g., Total Sales, YoY Growth, Average Order Value)
- Calculated columns for derived attributes
- Hierarchies for drill-down navigation (Year → Quarter → Month → Day)
- Row-level security (RLS) rules
- Translations for multi-language reports
- Metadata like descriptions and synonyms for Q&A natural language queries
Why Semantic Models Matter
Without a shared semantic model, every analyst building reports re-invents the same calculations and may produce slightly different numbers. Three problems this causes:
1. Inconsistent Numbers Across Teams
Sales reports the "Total Revenue" as $5.2M. Finance reports it as $5.1M. The difference: each team applied different filters and definitions. A shared semantic model defines "Total Revenue" once, and every report uses the same definition.
2. Maintenance Burden
When a calculation needs to change (e.g., new tax handling), without a semantic model you have to update every report. With one, you update the measure in the model and every report inherits the change.
3. Slow Time to Insight
Building a new report from scratch takes hours. Building one against an existing semantic model takes minutes — most of the work (data prep, relationships, measures) is done.
What's In a Semantic Model
A well-designed semantic model has several layers.
Data Layer
Tables imported from your source systems. In Power BI, these can come from:
- Databases: SQL Server, Snowflake, BigQuery, PostgreSQL, etc.
- Files: Excel, CSV, JSON, XML
- Cloud services: Salesforce, Dynamics 365, Google Analytics, SharePoint
- APIs: REST/OData endpoints
Relationship Layer
Connections between tables on shared keys. A typical star schema has:
- Fact tables with measurements (sales, orders, page views)
- Dimension tables with attributes (customers, products, dates, locations)
- Relationships linking facts to dimensions
Calculation Layer
DAX measures and calculated columns that derive new values from raw data. Common measures:
- `Total Sales = SUM(Sales[Amount])`
- `YoY Growth = DIVIDE([Total Sales] - [Sales LY], [Sales LY])`
- `Average Order Value = DIVIDE([Total Sales], [Order Count])`
Security Layer
Row-level security (RLS) rules that filter what each user sees. Common patterns:
- Regional managers see only their region
- Sales reps see only their accounts
- Executives see everything
Metadata Layer
Information that helps users discover and use the model:
- Friendly column names ("Customer Name" instead of `cust_nm`)
- Descriptions explaining what each measure means
- Synonyms for natural-language Q&A queries
- Display formats (currency, percentage, date)
Free SEO + AI Search Audit. A semantic model gives reports a consistent meaning. A free SEO audit gives your search visibility a consistent measurement — across every major platform. Get a free audit of how your site performs.
How to Build a Semantic Model
Building a semantic model in Power BI follows a standard sequence.
Step 1: Identify Business Questions
Before importing data, list the 10-20 questions stakeholders want to answer. "What's our monthly revenue by product line?" "Which customers are at churn risk?" "How do conversion rates compare across channels?" These drive what tables and measures you need.
Step 2: Import Source Data
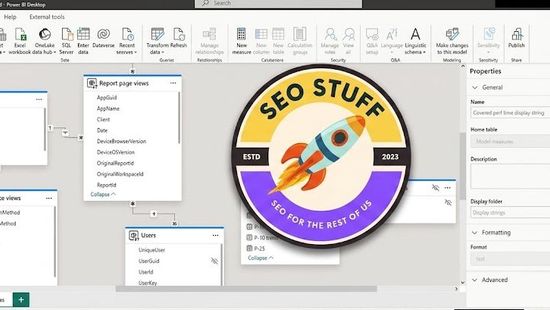
In Power BI Desktop, click Home → Get Data and connect to your sources. Import the relevant tables — but only what you actually need. Importing every table from a source database creates clutter.
Step 3: Clean and Transform Data
Use Power Query (in Power BI Desktop's Power Query Editor) to clean data:
- Rename columns to friendly names
- Set data types correctly
- Handle nulls and bad values
- Filter out rows you don't need
- Add calculated columns for derived attributes
Step 4: Define Relationships
In Power BI's Model View, drag related columns between tables to create relationships. Aim for a star schema — fact tables in the middle, dimension tables around them.
Step 5: Write DAX Measures
Create the measures your stakeholders need. Start with simple ones:
- `Total Sales = SUM(Sales[Amount])`
- `Order Count = COUNTROWS(Sales)`
- `Average Order Value = DIVIDE([Total Sales], [Order Count])`
Then build up to more complex ones:
- `YTD Sales = TOTALYTD([Total Sales], Calendar[Date])`
- `YoY Growth = DIVIDE([Total Sales] - CALCULATE([Total Sales], DATEADD(Calendar[Date], -1, YEAR)), CALCULATE([Total Sales], DATEADD(Calendar[Date], -1, YEAR)))`
Step 6: Add Metadata
For each measure and column:
- Add a description (visible in tooltips)
- Set the display format
- Add synonyms if you'll use Q&A
Step 7: Implement Row-Level Security
In Model → Manage Roles, define filters per role:
- "Regional Manager" → `[Region] = USERNAME()`
- "Sales Rep" → `[AccountOwner] = USERPRINCIPALNAME()`
Step 8: Publish to Power BI Service
Click Home → Publish. The semantic model goes to a workspace where other users can connect their reports to it.
Step 9: Set Up Refresh
In the Power BI Service, configure scheduled refresh so the model stays current with your source data.
When to Use a Semantic Model
Semantic models are essential in several scenarios.
1. Multiple Teams Need the Same Metrics
If sales, finance, and marketing all need to report on revenue, a shared semantic model ensures everyone sees the same number.
2. Self-Service BI With Governance
A semantic model lets analysts build their own reports while still using approved, governed business logic. The model author defines the rules; users build the visuals.
3. Reusable Calculations
If a complex calculation (e.g., revenue retention rate) is used in 10+ reports, defining it once in the model is cheaper than rebuilding it 10 times.
4. Row-Level Security Requirements
When different users should see different subsets of the same report, RLS in the semantic model handles it cleanly.
5. Q&A and Natural Language
Power BI's Q&A feature works against semantic models. Users can type "show me sales by product last month" and Power BI generates the visual. The model's metadata determines how well this works.
Free SEO + AI Search Audit. Semantic models keep your team aligned on data meaning. SEO Stuff keeps your team aligned on visibility — what's working, what's blocking citations, what to fix. Run a free audit to see exactly where your site stands.
Limitations of Semantic Models
Semantic models are powerful but have constraints.
Authoring requires Power BI Desktop. You can't fully author a semantic model in the web service — Desktop is required for the rich modeling experience.
Size limits in Pro tier. Power BI Pro caps semantic models at 1 GB compressed. Larger models require Premium Per User ($20/user/month) or Premium Per Capacity.
DAX learning curve. Writing good DAX measures is a skill. Common beginner mistakes around filter context lead to wrong answers that look right.
Refresh complexity. Scheduled refresh can fail due to credential issues, source changes, or timeouts. Monitoring and alerting on refresh health adds operational overhead.
Single source of truth requires discipline. If multiple teams create their own semantic models for the same data, you re-create the inconsistency problem at the model level. Governance matters.
Mac authoring gaps. Power BI Desktop is Windows-only. Mac users either use a VM or the (more limited) Power BI Service web authoring.
Semantic Model vs Other Concepts
Three related concepts that often get confused with semantic models.
Semantic Model vs Dataflow
A dataflow is the data-preparation step: pulling data from sources, cleaning it, and storing the cleaned result in Power BI. A semantic model is the analytical layer on top — relationships, measures, security. Dataflows feed semantic models.
Semantic Model vs Datamart
A datamart is a managed cloud database within Power BI (premium feature). A semantic model can live on top of a datamart, or directly on top of an external database. Datamarts add SQL endpoints and managed storage.
Semantic Model vs Dataset (Old Name)
These are the same thing. Microsoft renamed "dataset" to "semantic model" in late 2023. You'll still see "dataset" in some UI, documentation, and APIs — it means the same thing.
How Semantic Models Work in Microsoft Fabric
In Microsoft Fabric (the broader analytics platform that includes Power BI), semantic models play the same role but are more integrated:
- They live in Fabric workspaces alongside lakehouses, warehouses, and notebooks
- They can be built on top of OneLake data without copying it (Direct Lake mode)
- They support the full Fabric capacity model for sharing with free users
Direct Lake mode is particularly interesting — it lets a semantic model query Parquet files in OneLake directly, getting Power BI's analytical performance without the import step. This is a major architectural shift from traditional Power BI where data had to be imported into the model.
Final Thoughts
A semantic model is the spine of a serious Power BI deployment. Skipping it means every report is a one-off; investing in it means consistent metrics, faster report development, and governed self-service BI. The naming changed from "dataset" to "semantic model" in 2023 to emphasize what it is: the layer where data gets business meaning.
Once your data has business meaning, the next question for most teams in 2026 is whether your business is showing up in AI search engines like ChatGPT, Claude, Perplexity, and Gemini. Most teams have no measurement of where they stand in those AI answers. Run a free audit to see exactly where your site performs across Google AND every major AI search platform — and which fixes will move your traffic the fastest this quarter.