What Is a Good Goal Conversion Rate in Google Analytics? (2026 Guide)
 Carlos Garcia5/26/2026
If you've been staring at a Google Analytics 4 conversion rate number and wondering whether it's good, bad, or just average — you're not alone. A good goal conversion rate in Google Analytics is typically 2-5% for most websites, but the realistic benchmark varies significantly by industry, traffic source, intent, and goal type — ecommerce sites average 1-3%, lead-gen B2B sites 2-5%, SaaS trial signups 5-10%, branded paid search 8-15%, and high-intent landing pages 10-25%; "good" is anything meaningfully above your industry median once you account for your traffic mix. This guide explains how GA4 calculates goal conversion rate, realistic 2026 benchmarks by industry, why averages are misleading, and how to set targets that actually mean something for your business.
Free SEO + AI Search Audit. Conversion rate measures what visitors do after they arrive. A free SEO + AI search audit shows you whether the right visitors are arriving in the first place — from Google AND AI search engines like ChatGPT, Claude, Perplexity, and Gemini. Run your free audit → for a 60-second visibility snapshot.
What Is a Good Goal Conversion Rate? The Direct Answer
In simple terms, a good goal conversion rate in GA4 is the share of sessions (or users) that complete a defined conversion event, measured against a realistic benchmark for your industry, traffic mix, and goal type. The single most-quoted "average" is 2-5%, but that number is almost meaningless without context.
Examples of what "good" looks like in 2026:
- Ecommerce site (general): 1.5-2.5%
- Ecommerce site (top quartile): 4%+
- B2B lead-gen form: 2-5%
- SaaS free-trial signup: 5-10%
- Newsletter signup: 1-3%
- Branded paid search to a landing page: 8-15%
- Cold paid social to a landing page: 1-3%
- High-intent buyer landing page: 10-25%
These are rough orientations. Your actual "good" depends on a half-dozen variables we'll cover below.
How GA4 Calculates Goal Conversion Rate
The mechanics behind the number.
What Counts as a Conversion in GA4
In GA4 (renamed Universal Analytics' "goals" to "conversions" and then to "key events" in 2024-2025), a conversion is any event you mark as a key event in Admin → Events → Mark as conversion (or the newer "Mark as key event" toggle). Examples:
purchaseeventsign_upeventgenerate_leadevent- Custom events like
pricing_page_engagementordemo_requested
The Conversion Rate Formula
GA4's default conversion rate metric is computed as:
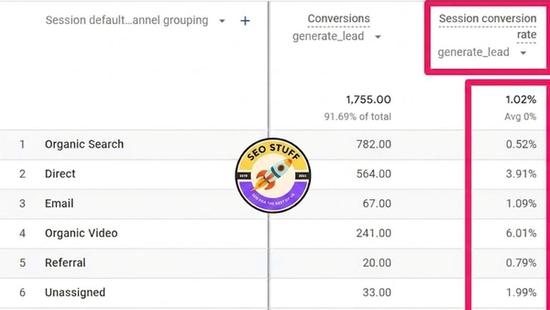
Session Conversion Rate = (Sessions with at least one conversion event) ÷ (Total sessions)
There's also a User Conversion Rate that measures unique users instead of sessions. They're meaningfully different — choose the one that matches your business question.
Where to Find the Number
Conversion rate appears in:
- Reports → Engagement → Conversions (overview)
- Reports → Acquisition → Traffic Acquisition (rate by channel)
- Reports → Engagement → Pages and Screens (rate by landing page)
- Explorations (custom report views)
Modeled vs Observed
GA4 reports include modeled conversion data for consent-denied users by default. If you're under strict consent regimes (or have analytics consent disabled), the displayed conversion rate may differ from what's in your CRM.
Realistic 2026 Conversion Rate Benchmarks by Industry
What "average" really looks like.
Ecommerce
- All ecommerce average: 1.5-2.5%
- Health & beauty: 3-4%
- Electronics: 1-2%
- Apparel: 2-3%
- Home & garden: 2-3%
- Luxury / high-ticket: 0.5-1%
- Top quartile ecommerce: 4%+
- Top decile ecommerce: 6%+
B2B / Lead Generation
- B2B lead-gen average: 2-5%
- Software & SaaS lead-gen: 5-7%
- Professional services: 2-4%
- Industrial / manufacturing: 1-3%
- B2B free trial signup: 7-12%
- B2B demo request: 1-3%
SaaS
- Free trial → signup: 5-10%
- Free trial → paid: 15-25% (of trialists, not total visitors)
- Pricing page → trial: 3-8%
- Homepage → trial: 1-3%
Content Sites
- Newsletter signup: 1-3%
- Free download / lead magnet: 5-15%
- Affiliate click-through: 2-5%
- Ad click-through (if running display): 0.5-2%
Mobile App
- Install rate (mobile web visit to install): 0.5-2%
- App open → key event: 5-15%
Why "Average" Benchmarks Are Misleading
Why the 2-5% number rarely applies cleanly to your site.
1. Traffic Source Matters Enormously
Branded paid search converts 5-10× higher than cold paid social. A site with 80% branded traffic naturally shows higher conversion rates than one with 80% cold acquisition — same product, same funnel, completely different numbers.
2. Funnel Stage Matters
A site that drives traffic to a top-of-funnel content page can never compete with a site that drives traffic directly to a high-intent buyer landing page. Different goals, different rates.
3. Geographic Mix Matters
Conversion rates vary 2-3× across countries. US visitors typically convert higher than emerging-market visitors. Multi-country sites blend rates.
4. Mobile vs Desktop Matters
Desktop typically converts 1.5-2× higher than mobile for most purchases. Sites with mobile-heavy traffic show lower headline rates without underperforming.
5. Industry Definitions Vary
What counts as a conversion in one industry is wildly different in another. Don't compare a $9.99 ebook checkout to a $50,000 B2B demo request — they shouldn't have the same rate.
6. Goal Type Matters
A free newsletter signup converts at 3-5× the rate of a paid purchase. Don't confuse "conversion rate" for goal A vs goal B.
Free SEO + AI Search Audit. Conversion rate is the back half of growth. The front half is whether the right people are finding you. A free SEO + AI audit shows your visibility across Google AND every major AI search platform. Get a free audit.
How to Set a Realistic Conversion Rate Target
A practical framework.
1. Establish Your Baseline
Use 60-90 days of GA4 data to find your current conversion rate at the goal level you care about. Don't use single-week numbers.
2. Segment by Traffic Source
Pull conversion rate by source/medium. Your branded organic, direct, and email rates are usually 3-5× your paid social or display rates. Set goals per segment.
3. Compare Against Industry Median (Not Best)
Don't aim for "top quartile" on day one. Aim to be at industry median first, then push to top quartile.
4. Set Improvement Targets, Not Absolute Targets
"+25% conversion rate this quarter" is a better goal than "5% conversion rate." Relative targets keep the team motivated whether you started at 1% or 4%.
5. Watch the Right Numerator
A "conversion rate increase" that comes from filtering out low-intent traffic (lower denominator) is different from one that comes from better persuasion (higher numerator). Both are good, but watch for which one you're driving.
6. Cap Reasonable Aspirations
10-15% conversion rate is exceptional. 25-50% conversion rate is suspect — usually a goal-definition problem (counting a non-conversion event as conversion, or filtering out most of the actual traffic).
How to Read Your Conversion Rate
Practical patterns.
Compare to Yourself Over Time
Most useful comparison: this quarter vs last quarter. Removes industry noise.
Compare Across Channels
Branded vs non-branded. Paid vs organic. Email vs social. The shape of these comparisons tells you where to invest.
Compare Across Landing Pages
A 1% landing page and an 8% landing page on the same site — that gap is usually fixable. Audit the high performer and replicate.
Compare New vs Returning Users
Returning users convert at 2-5× the rate of new users. The conversion rate gap reveals how much of your traffic is genuinely new vs re-engaged audience.
Watch for Seasonality
Most industries have seasonality. A "drop" in rate vs last month might just be normal seasonal pattern. Compare year-over-year before raising alarms.
Watch for Tracking Breaks
Sudden conversion rate spikes or drops are usually tracking issues — broken pixels, duplicate events, wrong goal setup, or consent-mode changes. Audit before celebrating or panicking.
Free SEO + AI Search Audit. Improving conversion rate is half the equation. Driving qualified traffic in the first place is the other half. A free SEO + AI audit covers both. Get yours →
How to Improve Conversion Rate
The actual levers.
1. Match Landing Pages to Search Intent
A page that exactly answers the user's query converts 3-5× higher than a generic landing page. Build pages around specific intents.
2. Reduce Form Friction
Each additional form field drops conversion rate ~5-10%. Audit forms ruthlessly; remove every non-essential field.
3. Add Social Proof
Reviews, testimonials, case studies, logos of customers — all measurably improve conversion when placed near decision points.
4. Improve Page Load Speed
Every second of delay drops conversion rate ~7%. Lighthouse score 90+ is a real conversion lever.
5. Strengthen Calls-to-Action
A specific, action-oriented CTA ("Start your free 14-day trial") outperforms a generic one ("Get started") by 15-25%.
6. Re-Engage Cart Abandoners
Email/SMS sequences for cart abandoners typically recover 10-30% of abandoned carts — boosting blended conversion rate meaningfully.
7. A/B Test Pricing Presentation
Pricing layout, anchor pricing, currency display, and payment options all affect conversion. Test one variable at a time.
Free SEO + AI Search Audit. Conversion rate is only as useful as the traffic feeding into it. A free SEO + AI search audit shows you whether the right kind of traffic is even reaching your site. Run yours →
Limitations of GA4 Conversion Rate Data
A few honest caveats.
Consent mode affects accuracy. Sessions from consent-denied users are modeled, not observed. Heavy modeling skews precise rate calculations.
Cross-device gaps. GA4 attempts cross-device user stitching but doesn't capture everything. Users who research on mobile and convert on desktop may register as two separate users.
Bot traffic isn't always filtered. Invalid traffic from bots and crawlers inflates the denominator without contributing to numerator, depressing rates.
Event definitions can drift. If your conversion event definition changed (new versions, attribution model updates), historical comparisons need a careful baseline reset.
Sampling kicks in at scale. Very large datasets in GA4 sometimes get sampled, which introduces noise in conversion rate calculations.
Attribution model affects which sessions get credit. Data-driven attribution (the GA4 default) vs last-click vs first-click can show meaningfully different conversion attributions for the same data.
Conversion Rate Red Flags
Patterns that suggest the number isn't measuring what you think.
1. 0% Conversion Rate
Either the goal isn't firing (broken tracking) or genuinely no one's converting. Inspect via DebugView and Real-Time first.
2. >50% Conversion Rate
Usually a goal-definition error — counting page views as conversions, or filtering out 90% of sessions in your view.
3. Identical Rate Across All Channels
If branded organic, paid social, direct, and email all convert at exactly 2.3%, that's suspicious. Most attribution issues hide here.
4. Sudden Jumps
10%+ shifts in a single week without a campaign change usually indicate tracking changes, not real performance changes.
5. New Sessions Converting at Higher Rates Than Returning
Returning users almost always convert higher. If new beats returning, something's wrong — usually goal counting users who came back to redeem a coupon as "new."
6. Mobile Converting Higher Than Desktop
For most ecommerce and B2B sites, desktop beats mobile. If mobile is higher, double-check the goal definition (often it's a mobile-only ad redirect counting).
Final Thoughts
A good goal conversion rate in Google Analytics is typically 2-5% for most websites, but the realistic benchmark depends heavily on industry, traffic source, goal type, and audience intent — ecommerce averages 1.5-2.5%, B2B lead-gen 2-5%, SaaS trial signups 5-10%, and branded paid search 8-15%, while top-quartile sites in each category typically perform 1.5-2× the median. The smarter approach is to set improvement targets relative to your own baseline, segment by channel and landing page, and avoid comparing yourself to inflated "top decile" benchmarks that don't reflect your traffic mix. Watch out for tracking errors, consent-mode noise, and goal-definition issues that artificially inflate or deflate the headline number.
Beyond conversion rate optimization, the bigger 2026 question for most marketing teams is whether the right audience is finding your site in the first place. Increasingly, that discovery happens inside AI search engines like ChatGPT, Claude, Perplexity, and Gemini — channels that drive high-intent visits but don't show up cleanly in GA4 attribution. Run a free audit to see exactly where your site shows up across Google AND every major AI search platform — and which fixes will move both your traffic and your conversion rate the fastest this quarter.
Want this done for you?
SEO Stuff gets businesses cited by ChatGPT, Gemini, Perplexity and Claude, and ranking in Google. Start with the free audit, a call, or the package.
See where you stand
A free, manual SEO + AI search audit of your site, with a report within 48 hours. No credit card, no sales call.
Get the free auditTalk it through
A free 20-minute call with the founder about whether AI search is a meaningful opportunity for your business.
Book a callHave it done
The Done-For-You Package: audit, 10 pages of content, 3 DR50+ placements, dashboard. $999 once, delivered in 21 business days.
See the package

