What Is a Dimension in Google Analytics? (2026 Guide)
 Carlos Garcia5/24/2026
If you've been building reports in Google Analytics 4 and run across the terms "dimensions" and "metrics" — and wondered exactly what dimensions are, how they differ from metrics, and why every report has a dimension picker — you're not alone. A dimension in Google Analytics is a descriptive attribute of your data, like the page someone visited, the country they came from, the device they used, or the campaign that referred them; dimensions are how you slice metrics into meaningful breakdowns. This guide explains exactly what dimensions are, how they differ from metrics, the most useful built-in dimensions in GA4, and how to create custom dimensions for your own data.
Free SEO + AI Search Audit. Dimensions slice your analytics into meaningful pieces. A free SEO + AI search audit slices your visibility across Google AND in AI search engines like ChatGPT, Claude, Perplexity, and Gemini. Run your free audit → to see where your site stands in 60 seconds.
What Is a Dimension in Google Analytics?
In simple terms, a dimension is a descriptive attribute of your traffic data — the "what," "where," "how," and "who" you can use to slice your metrics. Dimensions answer questions like:
- *Which page* did the user view? (page_path)
- *Where* did the user come from? (source / medium)
- *What device* did they use? (device category)
- *Which country* are they in? (country)
- *What campaign* drove them? (campaign)
Metrics, by contrast, are the numbers — sessions, users, conversions, revenue. Dimensions are how you categorize and group those numbers.
In every GA4 report, you'll see a primary dimension picker (often something like "Page path") and metrics columns (sessions, users, conversions). The dimension defines the rows; the metrics define the columns.
Dimensions vs Metrics
How they differ.
Dimensions
- Categorical attributes
- Define how you group data
- Are usually text (e.g., "Mobile," "United States," "Facebook")
- Examples: page, device, country, source, campaign, age, gender
Metrics
- Numeric values
- Define what you measure
- Always numbers (counts, sums, averages, percentages)
- Examples: sessions, users, conversions, revenue, engagement rate, average session duration
The Relationship
A report shows metrics broken down by dimensions. For example:
| Dimension (Device) | Metric (Sessions) | Metric (Conversions) |
|---|---|---|
| Desktop | 1,200 | 36 |
| Mobile | 2,400 | 48 |
| Tablet | 150 | 3 |
In this report, "Device" is the dimension; "Sessions" and "Conversions" are metrics.
Built-In Dimensions in GA4
GA4 comes with hundreds of standard dimensions across categories.
User Dimensions
- Age (in ranges: 18-24, 25-34, etc.)
- Gender (where Google can infer it)
- Country, Region, City
- Language
- New vs returning
- First user source / medium / campaign (acquisition attribution)
Session Dimensions
- Session source / medium / campaign
- Session default channel group (Organic Search, Direct, Paid Search, etc.)
- Landing page
- Session duration buckets
Event Dimensions
- Event name
- Page path, Page title, Page location
- Page referrer
- Search term
- Outbound link URL
Device & Tech Dimensions
- Device category (desktop, mobile, tablet)
- Operating system
- Browser
- Screen resolution
- Mobile model
Page & Screen Dimensions
- Page path + query string
- Page hostname
- Page title
- Content group (if configured)
Traffic & Acquisition Dimensions
- Source (e.g., google, facebook.com, direct)
- Medium (e.g., organic, cpc, referral, email)
- Campaign
- Term (keyword from Search Console linking)
- Ad content
Custom Dimensions in GA4
When built-in dimensions aren't enough, you create your own.
What They Are
Custom dimensions let you attach business-specific attributes to your events. Examples:
- Logged-in user role (admin, customer, guest)
- Subscription tier (free, pro, enterprise)
- Content category beyond what page-path captures
- A/B test variant the user saw
- Internal user ID for cross-platform analysis
How to Create One
- Admin → Custom definitions → Create custom dimensions
- Pick a name, scope (Event, User, or Item), and the event parameter or user property that feeds it
- Save
GA4 starts collecting data on that dimension going forward (it does NOT backfill).
Scopes Explained
- Event-scoped: tied to a specific event (e.g., the category of a button click)
- User-scoped: persists across sessions for a user (e.g., subscription tier)
- Item-scoped: applies to specific products in an e-commerce transaction
Free-Tier Limits
GA4's free tier limits custom definitions to:
- 50 event-scoped custom dimensions
- 25 user-scoped custom dimensions
- 10 item-scoped custom dimensions
GA4 360 raises these limits significantly.
Free SEO + AI Search Audit. Dimensions show you who and what's in your data. A free SEO + AI search audit shows you what's in the broader visibility picture — across Google AND every major AI search platform. Get a free audit.
How to Use Dimensions in GA4 Reports
The practical mechanics.
In Standard Reports
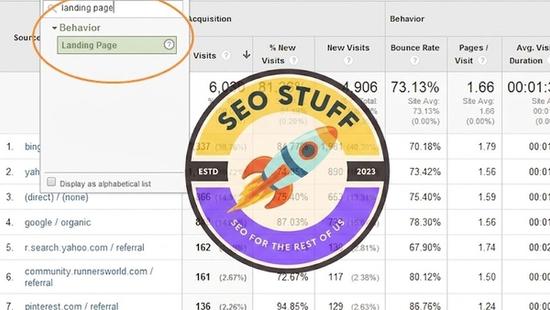
Every standard report has a Primary dimension dropdown above the data table. Change it to slice your metrics differently — e.g., switch the Traffic acquisition report from "Session default channel group" to "Session source / medium" for more granular attribution.
Adding a Secondary Dimension
Below the primary, click Add comparison or use the dimension picker to add a second dimension. This creates a two-level breakdown — for example, source by device.
In Explorations
Drag any dimension into the Rows or Columns of an exploration table. Combine multiple dimensions for deep custom analysis.
In Audience Builders
When building audiences in GA4, dimensions define the user segments — e.g., "users where Device category equals Mobile AND Country equals United States."
In Custom Reports
Use Looker Studio connected to GA4 to build dashboards with any dimension + metric combination you want.
Most Useful Dimensions for Common Questions
Match the question to the right dimension.
"Where Does Our Traffic Come From?"
Use Session source / medium or Session default channel group.
"Which Pages Get the Most Engagement?"
Use Page path and screen class with engaged sessions or average engagement time per session as the metric.
"Where Are Our Users Located?"
Use Country, Region, or City dimensions.
"Which Devices Convert Best?"
Use Device category with conversion rate or revenue as the metric.
"Which Campaigns Are Working?"
Use Session campaign combined with conversions or ROAS metrics.
"What Search Queries Drive Traffic?"
Use the Queries report under Search Console (requires the GA4-Search Console link).
"Which Audience Segments Are Most Valuable?"
Use Age, Gender, Interests, or custom User-scoped dimensions with revenue or LTV-equivalent metrics.
Common Dimension Issues in GA4
A few patterns that trip people up.
1. "(Not Set)" Showing as a Dimension Value
This means GA4 didn't capture a value for that dimension on that hit. Often happens when traffic comes from sources without referrer info or from privacy-restrictive contexts. Some "(not set)" is unavoidable; lots of it is a tagging issue.
2. "(Other)" in Reports
When a report has too many distinct dimension values, GA4 truncates and rolls overflow into "(other)." This is a sampling artifact on free GA4 properties. Reduce the date range or use a more aggregated dimension to fix it.
3. Custom Dimensions Show as Empty
You created a custom dimension but it's showing zero values. Most often: the event parameter or user property feeding it isn't actually being sent. Check with DebugView to verify the parameter is firing.
4. Page Path Includes Query Strings
Different versions of the same page (e.g., `?fbclid=...` polluted URLs) split rows. Configure GA4's excluded query parameters or use Page path (without query string) instead of Page path + query string.
5. Dimension Cardinality Limits
If a custom dimension has too many unique values (>500 typically), GA4 may sample or truncate. Use higher-level groupings when possible.
Dimensions vs Other GA4 Concepts
How dimensions fit with related concepts.
Dimensions vs Metrics
Already covered above — dimensions are categorical, metrics are numeric.
Dimensions vs Events
Events are user actions (page_view, purchase, click); dimensions are descriptive attributes that ride along with events. Many event parameters become dimensions in reports.
Dimensions vs Parameters
Parameters are the raw key-value pairs sent with events. Dimensions are how GA4 surfaces parameters in reports. You configure a parameter to be a "registered" dimension to make it available in the UI.
Dimensions vs Properties
User properties are user-level attributes (subscription tier, signup date). They become user-scoped dimensions when registered.
Dimensions vs Audiences
Audiences are user segments built using dimensions (and behavior). You define audiences by dimension filters; the audiences then become usable in remarketing.
Free SEO + AI Search Audit. Dimensions slice GA4 data. AI search citations are a parallel and growing source of organic visibility. A free SEO + AI search audit shows you where you stand. Run a free audit.
Limitations of Dimensions in GA4
A few honest caveats.
(not set) is unavoidable. Some dimension values will always be missing because of privacy, consent, or technical gaps.
Custom dimension caps. Free GA4 limits are 50/25/10 (event/user/item) — for enterprise schemas this hits faster than you'd think.
No retroactive backfill. When you add a custom dimension, GA4 starts collecting from that point forward. Historical events won't have the new dimension populated.
Sampling on high cardinality. Dimensions with thousands of unique values get sampled in large explorations.
API-only dimensions. Some dimensions are accessible only via the GA4 Reporting API, not the standard UI.
Final Thoughts
A dimension in Google Analytics is a descriptive attribute of your data — the "what" and "where" you use to slice your metrics into meaningful breakdowns. GA4 ships with hundreds of built-in dimensions across user, session, event, device, and acquisition categories, and you can create custom dimensions for business-specific attributes like subscription tier, content category, or A/B test variant. Dimensions and metrics work together: dimensions define the rows; metrics define the values. Master the dimension list for your common questions, and most GA4 reporting becomes straightforward.
Beyond GA4 dimensions, the bigger 2026 question for most marketing teams is where their visibility lives. Increasingly, traffic comes from AI search engines like ChatGPT, Claude, Perplexity, and Gemini — channels GA4 dimensions can't directly measure because most AI search traffic lands in the "Direct" channel. Run a free audit to see exactly where your site performs across Google AND every major AI search platform — and which fixes will move your traffic the fastest this quarter.