
How Do You Create a Normal Distribution Graph in Excel? (2026 Guide)
 Carlos Garcia9/27/2026
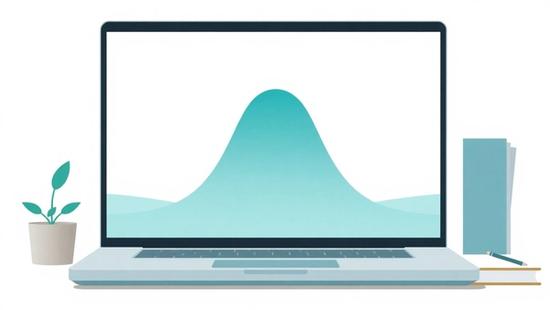
A normal distribution graph — the bell curve — is one of those charts that looks like it should be a single button in Excel and is not. There is no "Insert Bell Curve" option. You have to build the curve yourself from two summary statistics, then plot the result.
The good news is that the whole job is three formulas and one chart type. Once you have done it once, it takes about two minutes. This guide walks through the exact steps, explains what each formula is doing so you can adapt it to your own data, and covers the part most tutorials skip: how to lay the curve on top of a real histogram so the two actually line up.
The Short Answer
To create a normal distribution graph in Excel:
- Calculate the mean of your data with `=AVERAGE(range)`.
- Calculate the standard deviation with `=STDEV.S(range)`.
- Create a column of x-values running from about four standard deviations below the mean to four above, in small even steps.
- In the next column, use `=NORM.DIST(x, mean, standard_dev, FALSE)` to get the height of the curve at each x-value.
- Select both columns, then go to Insert → Charts → Scatter → Scatter with Smooth Lines.
That last argument — `FALSE` — is the one people get wrong. `FALSE` returns the probability density, which is the bell shape. `TRUE` returns the cumulative probability, which draws an S-curve instead.
Not sure whether your content shows up when people search for the thing you actually sell? Get a free SEO audit and see where you stand.
What a Normal Distribution Graph Actually Shows
A normal distribution is a specific, symmetrical shape defined entirely by two numbers: where its centre sits (the mean) and how spread out it is (the standard deviation). Change the mean and the whole curve slides left or right. Change the standard deviation and it gets taller and narrower, or shorter and wider. Nothing else about the shape can vary.
That is why you only need two statistics to draw one. You are not plotting your data points. You are plotting the idealised curve that your data's mean and spread imply.
Why the y-axis looks strange
The vertical axis on a bell curve is not a count and not a percentage. It is probability density, and the numbers on it are usually small decimals that look meaningless on their own — 0.08, 0.13, that sort of thing.
What matters is area, not height. The area under the whole curve equals 1, and the area under any slice of it is the probability of a value falling in that range. Height alone tells you only which values are relatively more likely than others.
The 68-95-99.7 rule
For any normal distribution, roughly 68% of values fall within one standard deviation of the mean, about 95% within two, and about 99.7% within three. This is why the x-range in step three runs four standard deviations either side — go much narrower and you clip the tails; go much wider and you waste chart space on a flat line.
How to Build It, Step by Step
Step 1: Get the mean and standard deviation
Put your raw data in a column — say A2:A101. In two spare cells, enter:
- `=AVERAGE(A2:A101)` for the mean
- `=STDEV.S(A2:A101)` for the standard deviation
Use `STDEV.S` when your data is a sample from a larger population, which is almost always the case in business reporting. Use `STDEV.P` only when your rows genuinely are the entire population — every employee, every transaction in a closed period, with nothing left out.
The difference is small on large datasets and material on small ones, so it is worth picking deliberately rather than grabbing whichever autocompletes first.
Step 2: Build the x-axis column
Say your mean landed in D1 and your standard deviation in D2. In a fresh column, put the starting value:
- `=$D$1 - 4*$D$2`
Then in the cell below it, add one step at a time. A clean step size is the standard deviation divided by 20, which gives you 160 points across the full range — smooth enough that the curve looks continuous:
- `=F2 + $D$2/20`
Drag that down until you pass `mean + 4*SD`. If you would rather not eyeball it, `=SEQUENCE(161, 1, $D$1-4*$D$2, $D$2/20)` does the whole column in one formula in current versions of Excel.
Fewer than about 50 points and the curve starts to look faceted at the peak. More than a few hundred adds nothing you can see.
Step 3: Calculate the curve height
Next to your first x-value, enter:
- `=NORM.DIST(F2, $D$1, $D$2, FALSE)`
Then fill down the full length of the x column. The absolute references on the mean and standard deviation matter — without the dollar signs, dragging the formula shifts those references and the curve collapses into nonsense.
You may still see `NORMDIST` without the dot in older workbooks. It still works for backwards compatibility, but `NORM.DIST` is the current function and the one to use in anything new.
Building reports that need to survive a sceptical audience? Run a free audit and find out what is holding your pages back.
Step 4: Insert the chart
Select both columns — x-values and curve heights together, including neither headers nor blank rows. Then:
- Go to the Insert tab.
- In the Charts group, click the scatter chart icon.
- Choose Scatter with Smooth Lines — the version with no markers.
You should get a clean bell shape immediately. If you get a jagged line, you picked "Scatter with Straight Lines". If you get a chart with two curves on it, Excel treated your x-column as a second data series — delete the extra series and set the x-values manually under Select Data → Edit.
Step 5: Tidy it up
Three quick changes make the difference between a working chart and a presentable one:
- Delete the legend. With one series it says nothing.
- Set the x-axis minimum and maximum explicitly to your `mean ± 4*SD` values, so Excel does not pad the ends with empty space.
- Give the y-axis a title that says "Probability density", because nobody reading it will guess.
If you want to mark the mean, add a second series with two points at the same x-value: one at y = 0 and one at the peak height. Formatted as a thin straight line, it reads as a centre marker.
How to Overlay the Curve on a Histogram
This is the version people usually actually want: the real distribution of the data as bars, with the theoretical normal curve drawn over it to show how closely they match.
The trick is that the two are on different scales. A histogram's y-axis counts observations. The curve's y-axis is density, topping out below 1. Plotted together without adjustment, the curve flattens into a line along the bottom.
There are two ways to fix it.
Scale the curve to the counts. Multiply each `NORM.DIST` result by the number of observations and by your bin width:
- `=NORM.DIST(F2, $D$1, $D$2, FALSE) * COUNT($A$2:$A$101) * bin_width`
Now the curve's height is in the same units as your bars, and a good fit looks like a good fit.
Or put the curve on a secondary axis. Right-click the curve series, choose Format Data Series, and select Secondary Axis. Faster, but the second axis invites misreading, so label it clearly or hide it once the scale looks right.
For the bars themselves, the `FREQUENCY` function with a column of bin upper bounds gives you counts you control, which is usually better than Excel's built-in histogram chart — that one chooses its own bins and does not let you line them up with anything.
Curious how much organic traffic your best pages are leaving on the table? Get a free SEO audit and find out.
When a Bell Curve Is the Right Chart
Use one when you are making a claim about the shape of a distribution, not about individual values. The three common cases:
- Quality and process work. Comparing measured output against specification limits, where you care how much of the distribution falls outside tolerance.
- Benchmarking a single value. Showing where one result sits relative to everything else — a score, a response time, a conversion rate against a set of comparable pages.
- Checking an assumption. Many statistical tests assume roughly normal data. Overlaying the curve on a histogram is a fast visual check before you rely on one.
If your point is "this went up" or "this segment is bigger than that one", a bell curve is the wrong tool. A line chart or a plain bar chart will communicate it faster.
Limitations Worth Knowing
The curve will look fine even when your data is not normal. `NORM.DIST` does not inspect your data. Feed it the mean and standard deviation of a wildly skewed dataset and it will still draw a perfect symmetrical bell — one that describes your data badly. Always plot the histogram too. The curve alone can hide the problem it is supposed to reveal.
Outliers move both inputs. A handful of extreme values pull the mean toward them and inflate the standard deviation, which shifts and flattens the curve at the same time. Check for outliers before you calculate, not after you have drawn the chart.
Small samples are unstable. Under about 30 observations, the mean and standard deviation bounce around enough that the curve you draw today may look meaningfully different from the one you draw next week with ten more rows.
Bounded data is not normal. Anything that cannot go below zero, or cannot exceed 100%, is not truly normally distributed — and if its mean sits close to a boundary, the curve will extend into impossible territory. Percentages, counts and durations all have this problem.
Want to know which of your pages are close to ranking and which are not even in the race? Get a free SEO audit.
Alternatives and How They Compare
Histogram on its own. Shows what your data actually did, with no assumptions bolted on. Less polished, more honest. If you only make one chart, make this one.
Box plot. Better when you are comparing several groups side by side. It gives you median, quartiles and outliers in a fraction of the space, though it hides whether a distribution has one peak or two.
Cumulative distribution curve. Change the last `NORM.DIST` argument from `FALSE` to `TRUE` and you get the S-shaped cumulative version. It is the better chart for questions phrased as "what share of values fall below this threshold", because you read the answer straight off the y-axis instead of estimating area.
Density plot in a statistics tool. R, Python or a dedicated BI tool will estimate the actual shape of your distribution rather than assuming it is normal. That is the right answer when the shape itself is the finding.
Google Sheets. The same approach works, with `NORMDIST` in place of `NORM.DIST` and the smooth-line option under chart type. The formulas are near-identical; only the chart editor differs.
Final Thoughts
A normal distribution graph in Excel comes down to three formulas — `AVERAGE`, `STDEV.S` and `NORM.DIST` with `FALSE` as the last argument — plotted as a smooth scatter line. Everything else is formatting.
The judgement call is not how to draw it. It is whether the curve belongs on your chart at all. A bell curve asserts that your data is symmetrical and single-peaked around its mean. Draw the histogram first, look at whether that is remotely true, and only then add the curve. When the two shapes agree, the overlay is genuinely persuasive. When they do not, the curve is worse than no chart, because it looks authoritative while describing something that is not there.
If you are cleaning up a dataset before any of this, standardising your values first often makes comparisons across differently-scaled columns much easier — our guide on how to normalize data in Excel covers the z-score method, which uses the same mean and standard deviation you have already calculated here.


